
使用 Nagios 抓取 AWS EC2 真實 CPU 使用量

top 或者是 uptime 指令去抓取 load average 來當作 CPU 負載 的指標。
load average: 0.07, 0.07, 0.05但當我們在 AWS 平台
環境
雲平台: AWS 環境: Ubuntu 14.04 Nagios Core: 4.2.4
部屬流程
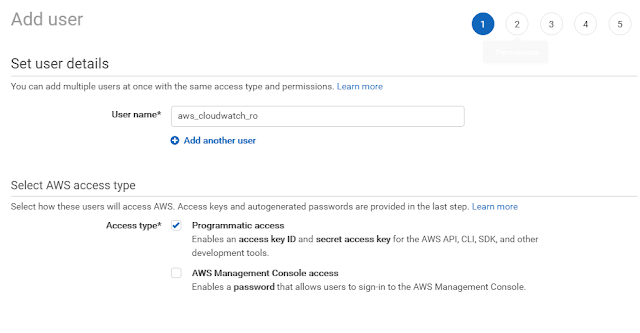
Step 1. 建立 AWS Access Key
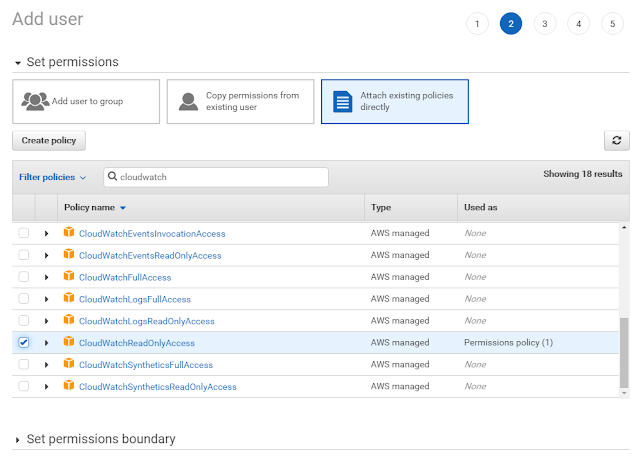
首先我們要在 AWS 平台上創建一隻 Access Key 並賦予 Cloudwatch 權限
建立一個新USER
賦予 Cloudwatch Read Only 權限
下載 Access Key

Step 2. 安裝所需套件
安裝 nagios 插件
pip install nagios-cloudwatch-plugin boto==2.49.0Step 3. 建立 nagios 要用的 aws credentials
cd ~nagios
mkdir .aws && chown nagios:nagios .aws
.aws 目錄下創建 credentials,寫入以下資訊
記得要改成自己的 access key
[default]
aws_access_key_id = your_aws_access_key_id
aws_secret_access_key = your_aws_secret_access_key
Step 4. 設定 Nagios
修改 commands.cfg
新增以下設定
# 'check_cloudwatch' command definition
define command{
  command_name   check_cloudwatch
  command_line   /usr/local/bin/check_cloudwatch.py -R $_HOSTAWS_REGION$ -n AWS/EC2 -m CPUUtilization -p 300 -d InstanceId=$_HOSTEC2_ID$ -w $ARG1$ -c $ARG2$
  }
設定主機 config 檔
加入以下設定,記得修改 ec2 的region 及 id
  _aws_region                     ca-central-1
  _ec2_id                         i-0a123123123123123
第一個驚嘆號代表 warning 的值,第二個是 critical
define service {
  use                           generic-service
  host_name                     hanktsai-example-001
  contact_groups                admins
  service_description           CPU Usage
  check_command                 check_cloudwatch!0:70!0:80
}
完整設定值範例
define host {
use linux-server
host_name hanktsai-example-001
alias hanktsai-example-001
address 172.20.1.1
_aws_region ca-central-1
_ec2_id i-0a123123123123123
contact_groups admins,igaming
max_check_attempts 5
check_period 24x7
notification_interval 30
notification_period 24x7
}
define service {
use generic-service
host_name hanktsai-example-001
contact_groups admins
service_description CPU Usage
check_command check_cloudwatch!0:70!0:80
}
Step 5. 完成
重啟服務
service nagios reload


留言